

Break-even ROAS is the return on ad spend at which an order pays for its own advertising and leaves nothing over. It is 1 divided by your contribution margin: what an order keeps after cost of goods, shipping, payment fees and returns, before any advertising. At a 40% margin it is 2.5, and any ROAS target should sit above it by the profit you want to keep.
What is break-even ROAS?
Break-even ROAS is the lowest return on ad spend at which advertising does not lose money on the order it brings in. Below it, every sale costs more to win than it leaves behind. Above it, each sale adds profit.
ROAS itself is revenue divided by ad spend: $1,000 of spend that brings in $3,000 is a ROAS of 3.0. Whether 3.0 is good depends on how much of each dollar of revenue you keep. Break-even ROAS turns your margin into that verdict.
Margin written as a decimal. At a 40% margin: 1 ÷ 0.40 = 2.5
How do you work out contribution margin per order?
Contribution margin is the order value minus every cost that rises and falls with each order, as a share of that order value. Product cost alone is not enough: shipping, packing, payment processing and returns come off every order too, and leaving them out makes break-even look lower than it is.
| One average order of $80 | Per order |
|---|---|
| Cost of goods | $30.00 |
| Shipping and packing | $9.00 |
| Payment fees (about 3% of the order plus a small fixed charge) | $2.60 |
| Returns allowance (8% of revenue refunded or written off) | $6.40 |
| Order keeps | $32.00 |
Costs total $48.00, so the order keeps $32.00: a 40% contribution margin and a break-even ROAS of 1 ÷ 0.40 = 2.5. Every $1 of ad spend has to bring back $2.50 in revenue before the business makes anything. The same $32.00 is your break-even cost per order, the most you can pay in ads to win one sale of this size.
Keep the number honest: take the averages from your own order data, over a period long enough to include a normal level of returns. And use the same revenue definition on both sides: if the revenue you count against ad spend includes shipping and tax charged to customers, the margin sum must start from that same figure.
Break-even ROAS at different margins
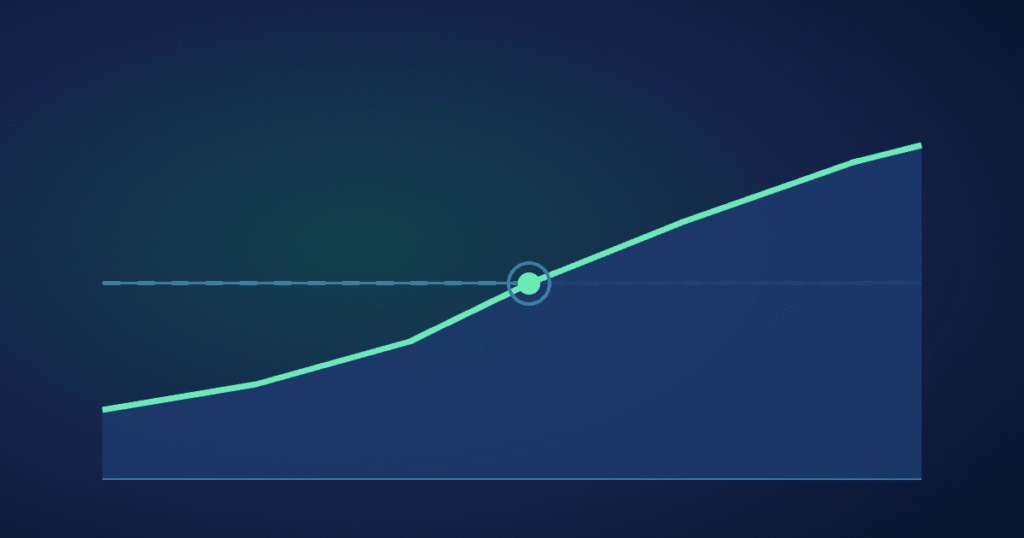
The lower the margin, the higher the ROAS a business needs just to stand still, and the curve is steep at the bottom.
Moving from a 20% to a 30% margin cuts the required ROAS by a third. Moving from 60% to 70% barely changes it. That is why price, bundles and shipping thresholds often do more for a low-margin store than any change inside the ad account.
A ROAS is not good or bad. It is above or below the margin underneath it.
How do you set a target ROAS from break-even?
Your target ROAS is break-even plus the profit you want each order to keep after advertising.
At a 40% margin, keeping 15% of revenue: 1 ÷ (0.40 − 0.15) = 1 ÷ 0.25 = 4.0
At a ROAS of 4.0, the $80 order spends $20 on ads and keeps $12.
The profit share should cover what contribution margin leaves out: rent, salaries, software, agency fees and the profit the owners expect. A store with $20,000 of monthly fixed costs and $200,000 of monthly revenue needs 10% of revenue for those alone, so a 15% target leaves 5% as profit.
Break-even ROAS calculator
Enter one average order. The defaults are the worked example above.
Illustrative defaults. Nothing you type is saved or sent anywhere.
Worth knowing: Google’s Target ROAS bidding takes the target as a percentage. Google Ads Help gives the example of $5 in sales for each $1 of ad spend becoming a 500% target, and lists at least 15 conversions in the past 30 days as the requirement for Search and Shopping campaigns.
What is a good ROAS for ecommerce?
A good ROAS is one that clears your own target, which means it sits comfortably above your break-even. Benchmarks show what is typical across many stores, not what is profitable for yours.
Large datasets are still useful context. Triple Whale’s Meta benchmarks, drawn from the brands on its platform over a 12-month window, put median Meta ROAS at 1.88. What that median means depends entirely on the margin underneath it.
Three more limits apply to any benchmark:
Channels do different jobs
Search often catches people already looking for a product, while social ads more often reach people who were not. Compare each channel with its own target.
Order value and repeat buying vary
A store whose customers come back several times can afford a lower first-order return than one that sells once.
Datasets differ
Each benchmark reflects the brands using that provider’s software and how it defines each metric. Different studies give different medians.
The practical answer: work out your break-even, set a target above it, and judge every campaign against that.
ROAS vs MER: which should you judge by?
ROAS measures the revenue credited to a campaign or channel against that channel’s spend. MER, the marketing efficiency ratio, divides total store revenue by total ad spend across every channel; some teams call it blended ROAS. They answer different questions, so both are worth tracking.
| ROAS | MER | |
|---|---|---|
| Formula | Campaign or channel revenue ÷ its ad spend | Total revenue ÷ total ad spend |
| Best for | Choosing between campaigns, products and creative | Deciding whether total spend can rise |
| Includes | Sales credited to that campaign | Every sale, including repeat and unpaid ones |
| Data you need | Ad account and analytics | Your order total and your ad invoices |
| Compare it with | That channel’s target ROAS | Your break-even and target, at business level |
Use ROAS to move budget inside a channel and MER to decide whether the business can afford more advertising overall. When MER sits above your target, the whole programme is paying for itself, and channel ROAS tells you where the next dollar should go.
Tip: whichever you choose, agree it before launch and calculate it from your own order data, so a good month and a bad month are judged on the same number.
Margin first, then budget
In our online sales work, purchase tracking is verified in writing before anything scales, and results are reported as blended ROAS and MER at your margin, so a good month is one that made money.
When can a lower first-order ROAS make sense?
A first-order ROAS below break-even can make sense when customers reliably buy again, because the first order is only part of what a new customer is worth. Lifetime value, the contribution a customer brings across all their orders, sets the real ceiling on what you can pay to win them.
Say your own order history shows new customers place 2.2 orders on average in their first 12 months, each keeping about $32. One customer is then worth about $70 in contribution, not $32.
First-order break-even ROAS: about 1.14, instead of 2.5 on the first order alone
That holds only if you are willing to wait for the money.
That headroom comes with conditions:
- Use repeat rates you have observed, not hoped for. Group customers by the month they first bought and see how many came back.
- Cash arrives later. The ad cost is paid now and the repeat contribution arrives over months, so the business has to be able to fund the gap.
- Repeat orders need a reason. Follow-up by email and messaging after the first order is what turns the average into reality, which is the work of lifecycle and retention.
- Track new customers separately. Revenue from returning customers can make overall ROAS look healthy while the cost of a new one climbs.
Ad platforms support this directly. Google Ads, for example, offers customer lifecycle goals with an option to bid higher for new customers than existing ones.
A step list to set your numbers today
- Find your average order value Pull 3 to 6 months of orders.
- List the variable costs per order Cost of goods, shipping and packing, payment fees, returns and refunds, and any discounts.
- Work out contribution margin Subtract those costs from the order value and divide by the order value.
- Calculate break-even Break-even ROAS is 1 ÷ margin; break-even cost per order is the margin in dollars.
- Set the target Decide the profit share you need after ads, then target ROAS is 1 ÷ (margin − profit share).
- Check repeat buying Look at your repeat rate by first-purchase month and decide whether lifetime value justifies a lower first-order target.
- Write down the number you judge by ROAS per channel, MER for the business or both, before spend changes.
- Recalculate when costs move Prices, suppliers, shipping rates or the product mix.
If you would rather not build the sheet yourself, our Ad Budget & Break-even Planner works out break-even and target ROAS and cost per order from your own costs, refunds and repeat orders. For how margin shapes store marketing more widely, see our ecommerce marketing page.
What owners ask about break-even ROAS
Is break-even ROAS the same as ROI?
No. ROAS divides revenue by ad spend, while ROI usually divides profit by the total investment. Break-even ROAS is the ROAS at which the profit from advertising is zero, so it is the point where ROI on that ad spend is also zero.
Should agency or software fees go into break-even ROAS?
They are not part of contribution margin, because they do not change with each order. Either cover them in the profit share of your target ROAS, or use a stricter test by adding the fees to ad spend before dividing revenue by it.
How do discounts change break-even ROAS?
A discount lowers revenue while product and shipping costs stay the same, so margin falls faster than the price. In the illustrative $80 order, a 20% discount cuts contribution from $32 to under $18 and pushes break-even ROAS from 2.5 to about 3.6.
What is break-even CPA?
Break-even CPA is the contribution margin of one order in dollars, which is the most you can spend on ads to win that order without losing money. An order that keeps $32 after variable costs has a break-even CPA of $32.
Does break-even ROAS work for digital products?
Yes, and it is usually low, because there is little or no cost of goods or shipping. Payment fees, refunds and any platform fees still count: a digital product that keeps 90% of each sale has a break-even ROAS of about 1.11.
From our projects: an incense charcoal brand reached 1,651 online orders in two months at a 5.07 return. An online dessert shop brought cost per order down from $29.65 to $8.47 over five campaign phases built around one hero product.
Want a second opinion on your own numbers?
In a strategy session we review your accounts, tracking and spend, and you leave with a written plan you keep either way. The session fee is credited in full toward any service that follows.